According to the General Statistics Office, Vietnam’s import and export activities in the first 11 months of this year reached a record trade surplus of 20.1 billion USD in the context of the complicated developments of the COVID-19 epidemic, causing negative impacts. to the world economy.
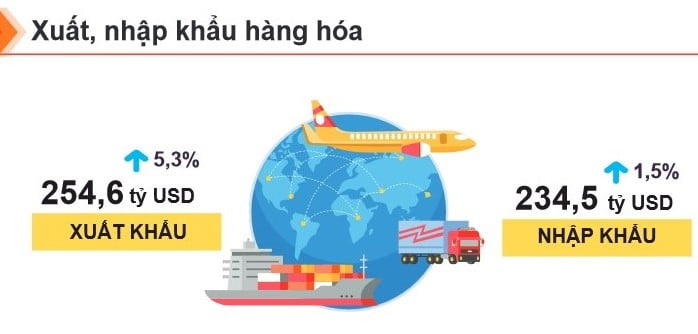
Specifically, according to the document No. 223/BC-TCTK, dated November 28, 2020, the report on the socio-economic situation in November and 11 months of 2020: Total export and import turnover of goods in 11 months is estimated to reach 489.1 billion USD, up 3.5% over the same period last year, of which exports reached 254.6 billion USD, up 5.3%; imports reached 234.5 billion USD, up 1.5%.
31 items with export turnover of over 1 billion USD
The export turnover of goods in October 2020 reached 27,259 million USD, 559 million USD higher than the estimated number, of which electronics, computers and components were 248 million USD higher; machinery, equipment, tools and spare parts higher than 208 million USD; phones and components higher than 149 million USD.
Merchandise export turnover in November 2020 was estimated at US$24.8 billion, down 9% from the previous month, of which the domestic economic sector gained US$7 billion, down 2.7%; FDI sector (including crude oil) reached 17.8 billion USD, down 11.3%. Compared to the same period last year, the export turnover of goods in November increased by 8.8%, of which the domestic economic sector increased by 8.2%, the foreign-invested sector (including crude oil) increased. 9%.
In the first 11 months of 2020, the export turnover of goods was estimated at 254.6 billion USD, up 5.3% over the same period last year, of which the domestic economic sector gained 73 billion USD, up 1. 6%, accounting for 28.7% of total export turnover; FDI sector (including crude oil) reached 181.6 billion USD, up 6.9%, accounting for 71.3%.
In 11 months, there were 31 items with export turnover of over 1 billion USD, accounting for 92% of total export turnover (of which 6 items were exported over 10 billion USD, accounting for 64.3%).
Specifically: Phones and components had the largest export turnover, reaching 46.9 billion USD, accounting for 18.4% of total export turnover, down 3.4% over the same period last year; electronics, computers and components reached USD 40.2 billion, up 24.3%; textiles and garments reached 26.7 billion USD, down 10.5%; machinery, equipment, tools and spare parts reached USD 23.9 billion, up 44.5%; footwear reached 14.9 billion USD, down 9.8%; wood and wood products reached 10.9 billion USD, up 14.1%; means of transport and spare parts reached 8.1 billion USD, up 4.1%; seafood reached 7.7 billion USD, down 0.9%. Besides, the 11-month export turnover of most agricultural products decreased compared to the same period last year: Vegetables and fruits reached 3 billion USD, down 11.7%; cashew nuts reached 2.9 billion USD, down 1.7% (the volume increased by 13.2%); coffee reached 2.5 billion USD, down 2.9% (the volume decreased by 3.9%); rubber reached USD 2 billion, down 1.4% (volume increased by 0.4%); pepper reached USD 596 million, down 11.5% (volume decreased by 1.8%); tea reached 201 million USD, down 5.3% (volume increased by 1.2%). Rice products alone reached US$2.8 billion, up 10.4% (a decrease of 2.2%).
Regarding the structure of export goods in 11 months, the group of heavy industrial goods and minerals was estimated at 138 billion USD, up 9.2% over the same period last year, accounting for 54.2% of the total export turnover of goods. increased by 1.9 percentage points over the same period last year). The group of light industrial products and handicrafts was estimated at US$ 90.2 billion, up 1.5% and accounting for 35.4% (down 1.3 percentage points). The group of agricultural and forestry products reached 18.7 billion USD, down 0.1% and accounted for 7.3% (down 0.4 percentage points). The group of aquatic products reached USD 7.7 billion, down 0.9% and accounting for 3% (down 0.2 percentage points).
Regarding the commodity export market, the United States was Vietnam’s largest export market in 11 months with a turnover of 69.9 billion USD, up 25.7% over the same period last year. Next is China with 43.1 billion USD, up 16%. The EU market reached 32.2 billion USD, down 2.4%. The ASEAN market reached 20.9 billion USD, down 10.6%. Korea reached 17.7 billion USD, down 2.7%. Japan reached 17.3 billion USD, down 6.5%.
Mainly import means of production
Import turnover of goods in October 2020 reached 24,320 million USD, 180 million USD lower than the estimated number, of which crude oil was 127 million USD lower; products from iron and steel less than 68 million USD.
Import turnover of goods in November 2020 was estimated at 24.2 billion USD, down 0.5% over the previous month, of which the domestic economic sector gained 8.6 billion USD, up 1%; FDI sector reached 15.6 billion USD, down 1.3%. Compared to the same period last year, the import turnover of goods in November increased by 13.4%, of which the domestic economic sector increased by 2%; the foreign-invested sector increased by 20.8%.
Generally, in the first 11 months of 2020, the import turnover of goods was estimated at 234.5 billion USD, up 1.5% over the same period last year, of which the domestic economic sector reached 85.43 billion USD, down. 9.6 %; FDI sector reached 149.07 billion USD, up 9.2%.
In the first 11 months of 2020, there were 34 items with import turnover of over 1 billion USD, accounting for 89.4% of total import turnover (there were 4 items with import turnover of over 10 billion USD, accounting for 49.3%). in which electronics, computers and components reached USD 57.4 billion (accounting for 24.5% of total import turnover), up 22% over the same period last year; machinery, equipment, tools and spare parts reached 33.1 billion USD, equal to the same period last year; phones and components reached 14.6 billion USD, up 9.3%; fabric reached 10.6 billion USD, down 12.3%; plastics reached 7.5 billion USD, down 9.4%; iron and steel reached 7.3 billion USD, down 16.7%; plastic products reached 6.5 billion USD, up 9.7%; automobiles reached 5.5 billion USD, down 18.5%; common metals reached 5.4 billion USD, down 7.5%; chemical products reached 5.1 billion USD, up 3.1%.
Regarding the structure of imported goods in the first 11 months of 2020, the capital goods group was estimated at 218.8 billion USD, up 1.6% over the same period last year and accounting for 93.3% of the total import turnover; consumer goods group was estimated at 15.7 billion USD, up 0.5% and accounting for 6.7%.
About the market import goods in 11 months, China is Vietnam’s largest import market with an estimated turnover of 73.9 billion USD, up 7.9% over the same period last year; Korea reached 42 billion USD, down 2.9%; ASEAN market reached 27.3 billion USD, down 6.9%; Japan reached 18.6 billion USD, up 4.8%; EU market reached 13.2 billion USD, up 4.3%; The United States reached $12.6 billion, down 3.6%.
The trade balance of goods in October 2020 had a trade surplus of 2.9 billion USD; 10 months of trade surplus of 19.5 billion USD; November trade surplus is estimated at 600 million USD. In the first 11 months of 2020, the trade balance of goods is estimated to have a record trade surplus of 20.1 billion USD (the same period last year, the trade surplus is 10.8 billion USD), of which the domestic sector has a trade deficit of 12.4 billion USD. USD; the foreign investment sector (including crude oil) had a trade surplus of 32.5 billion USD.
According to the electronic newspaper Chinhphu.vn
CONTACT INFO
TT EX-TRANS’S MAIN OFFICE
77 Dao Duy Anh, Ward 9, Phu Nhuan District, Ho Chi Minh City
+84 909 44 67 68
ttextrans@thanhtrungcorp.com.vn